Service DashboardFeatures
Reports and Dashboards
SLA, coverage, labor, workflow completion — the numbers leadership looks at.
Reports and Dashboards
The main dashboard
Default landing page for admins and managers. Shows:
- Today's events count + unassigned count
- Active staff hours
- Open tickets
- Pending workflows
- Estimated labor hours this week
- Auto-syncing venues vs venues needing feed URLs
- Labor by staff (who's doing what this week)
- Events by market, by league
- Workflow completion percentages
All live, all queryable.
Alerts
A strip of critical alerts runs across the dashboard:
- Events today with no staff assigned
- Events starting within 2 hours with no check-in
- Events within 1 hour still not game-ready
- Overdue post-game reports from yesterday
- Upcoming events this week needing assignment
SLA report
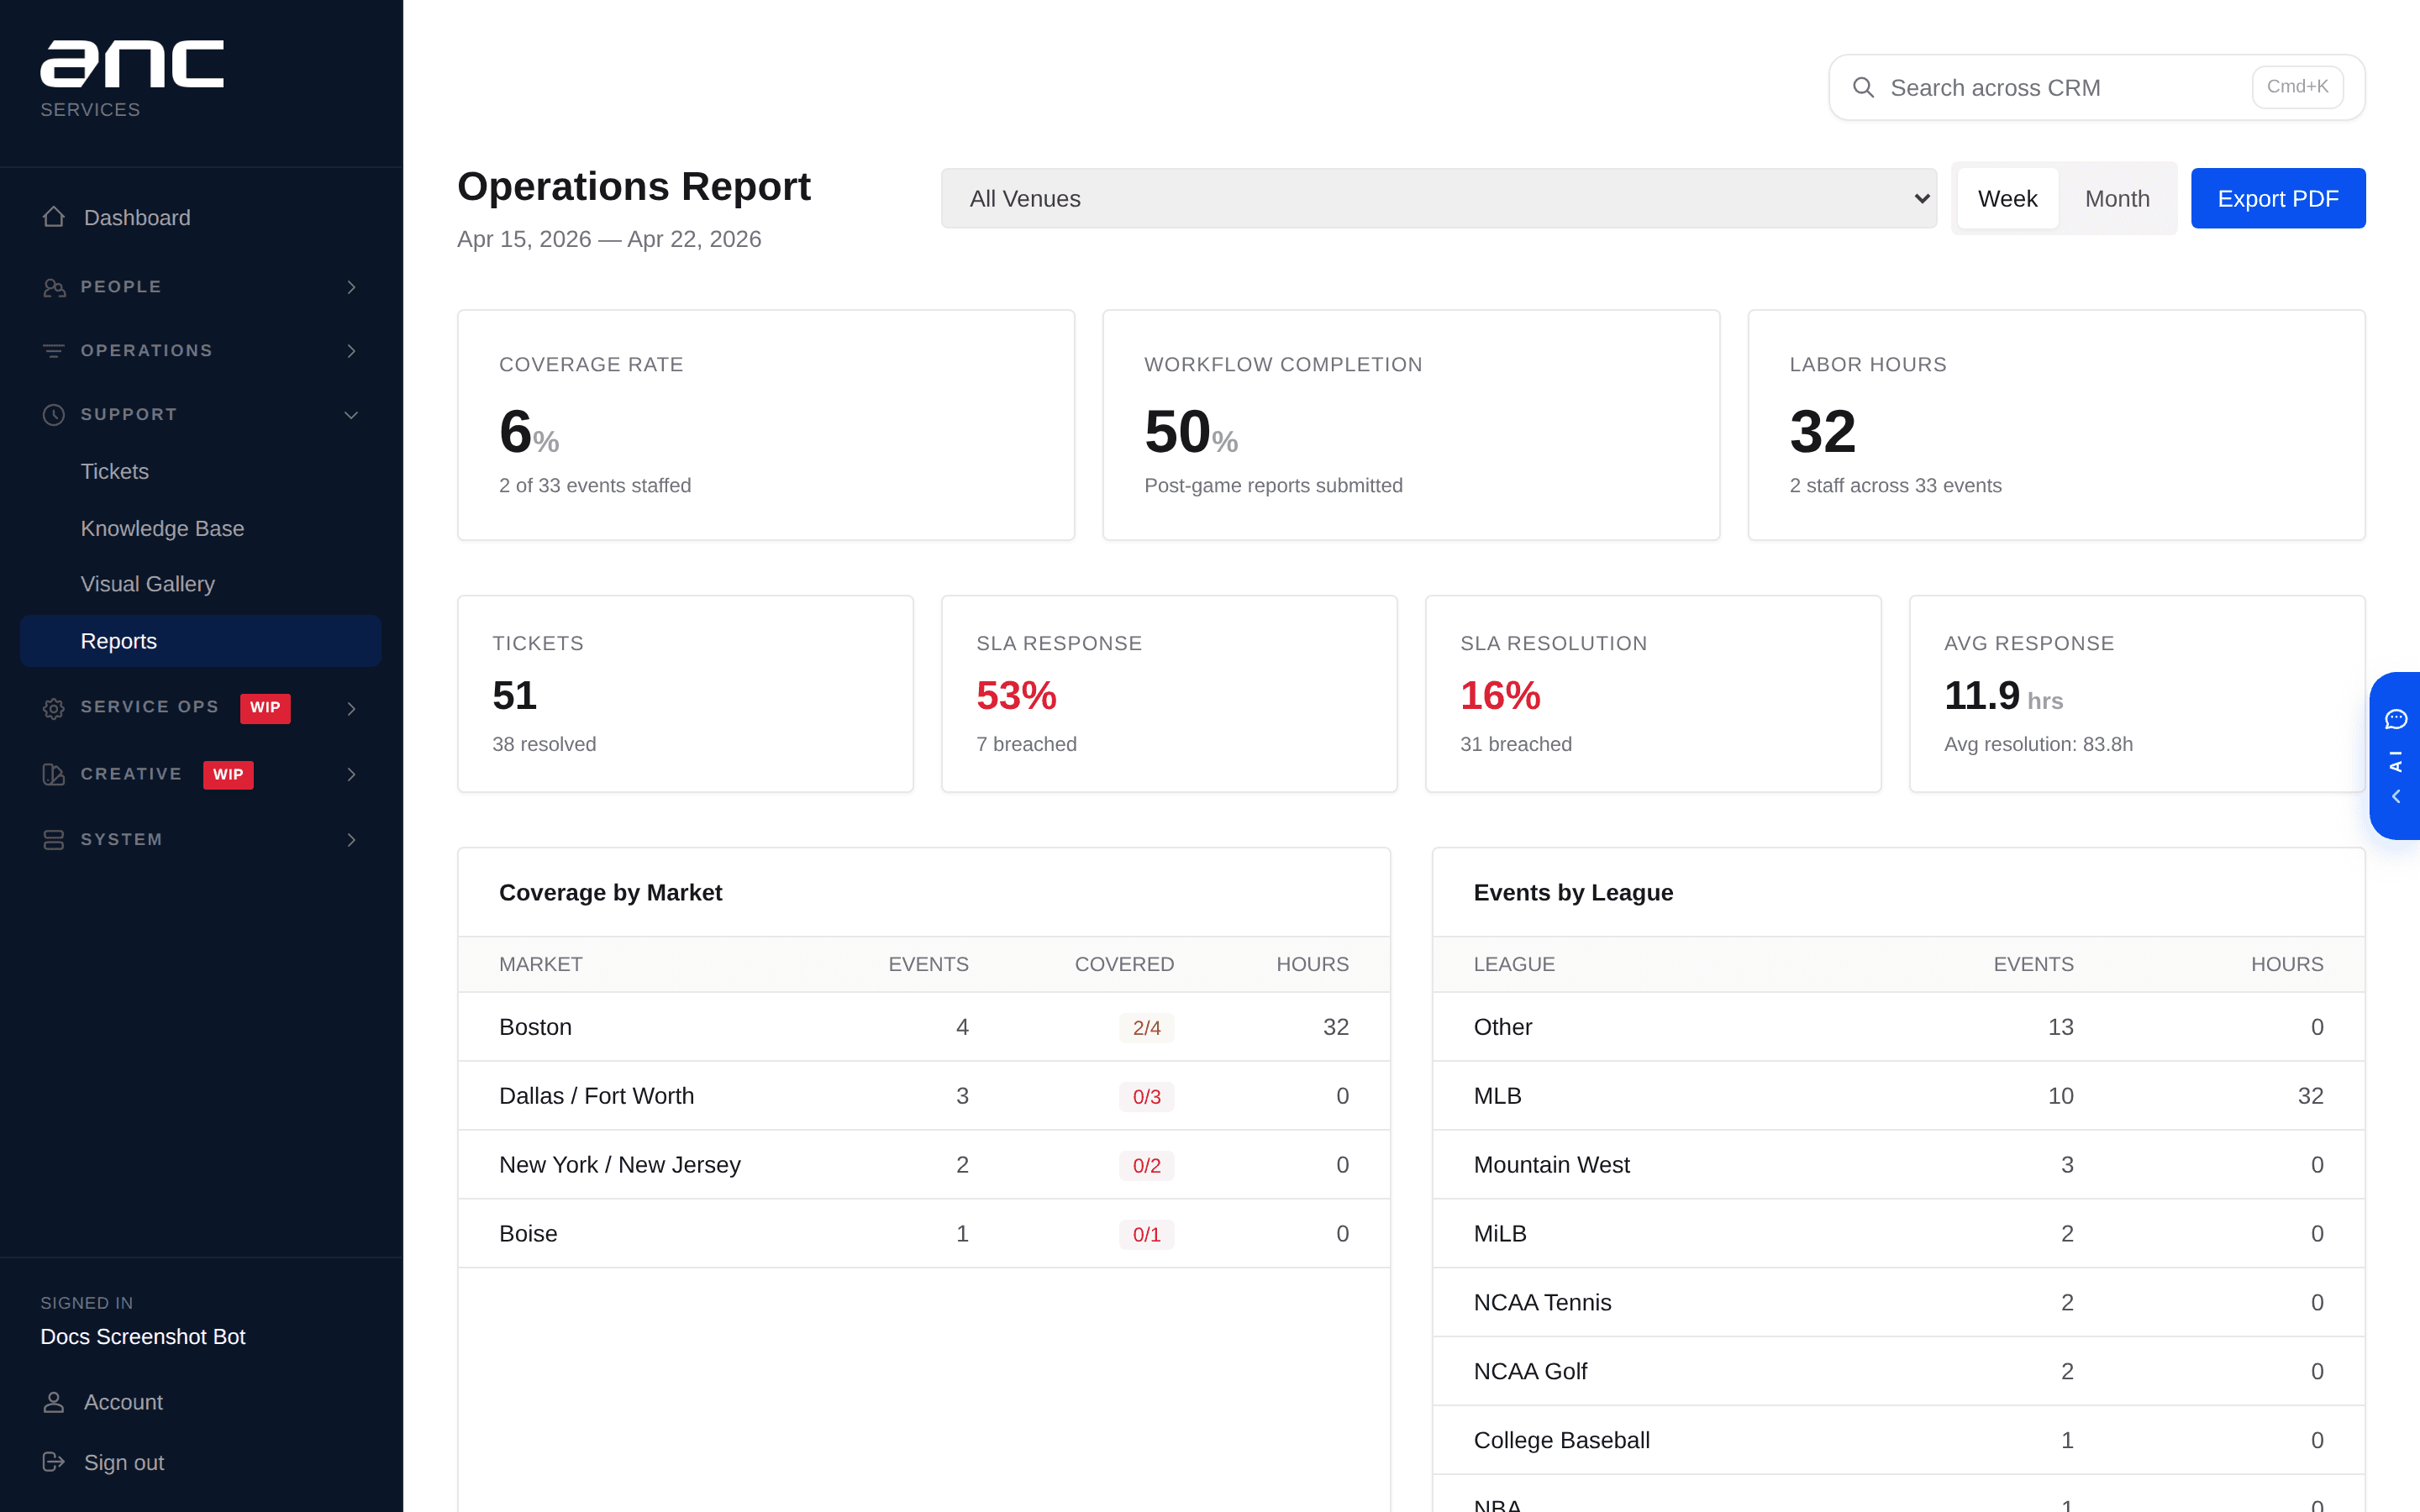
/reports — SLA compliance metrics across tickets:
- % responded within SLA
- % resolved within SLA
- Average response time
- Average resolution time
- Breached ticket list
Monthly service report PDF
Per-venue, branded, auto-generated. Pulls the month's events, tickets, workflow completion rate, labor hours, and incident notes into a single PDF for the client. Admins can generate on demand; scheduled delivery is configurable per-venue.
Executive ops report PDF
A C-level rollup with executive summary, trend arrows (coverage up/down vs prior period), and action items. Built for leadership reviews.
See also
- AI Assistant — ask the same questions in natural language
- Workflows — the data these reports pull from